
This post extends my Mental Health in Tech analysis by harmonizing the 2014 OSMI baseline with waves from 2016–2023.
What changes when we add in 2014?
The central question this seeks to answer is: Do visible workplace supports- policy pillars (benefits, care_options, seek_help, anonymity, wellness_program)-still correlate with a higher likelihood of seeking treatment when we combine later OSMI waves with the 2014 baseline?
TL;DR
- Pooled OSMI waves (2014, 2016-2023) confirm and strengthen the Part-1 finding that visibility of supports correlates with higher treatment-seeking.
- Bigger sample size tightens error bars and surfaces new significant contrasts between support groups.
- The story didn’t change. Visibility is leverage, though the multi-year lens makes it louder and clearer.
- If you raise support and make it impossible to miss, more people get help. That’s good for people and productivity.
Quick observations from the pooled dataset
- Demographics stable; age/gender mix comparable to 2014.
- Treatment-seeking higher than baseline in several later waves (2019 omitted).
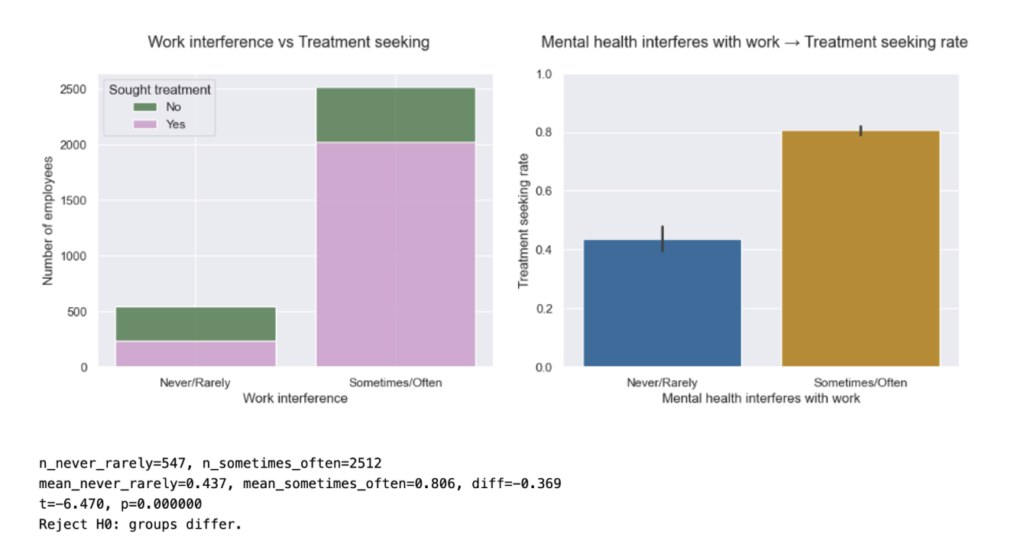
- Work interference grew (Sometimes/Often), but within-group treatment rates look comparable to the baseline.
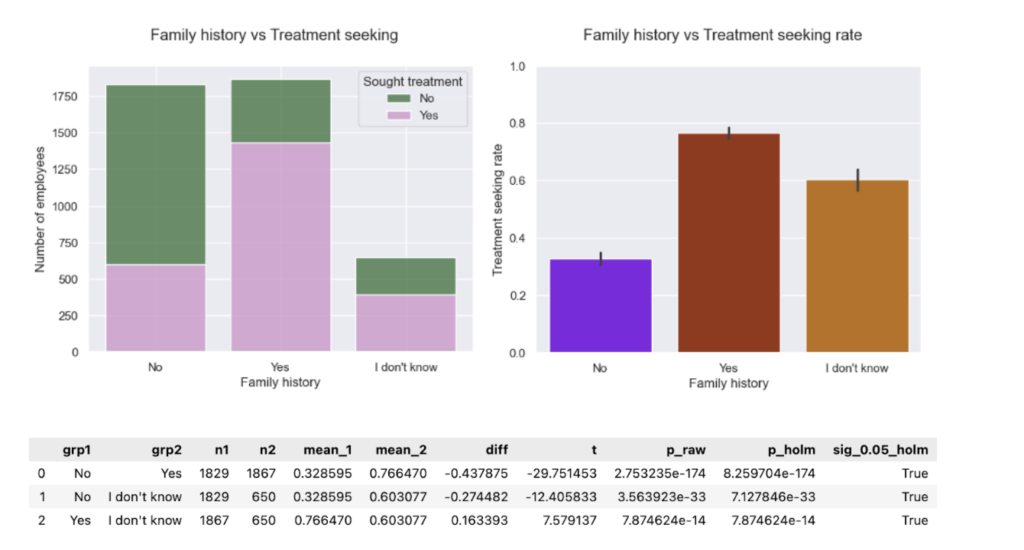
- Family history: “Don’t know” ~60% seeking treatment vs No ~30%, Yes ~80% -a practical flag.
- Support score curve: steadier rise, plateau after ~3; more significant contrasts (0 vs >=1; 1 vs >=3; 2 vs >=3).
Data & harmonization
Single pipeline maps later-wave headers to 2014 semantics, recodes to Yes/No/Don’t-know, and builds the 0-5 support score. Data for 2019 lacks the treatment item. (Methods as in Part-1.). Stats: for >2 group comparisons, one-way Welch’s ANOVA followed by pairwise Welch’s t-test, and for 2 group comparisons Welch’s t-test was used.
What I found
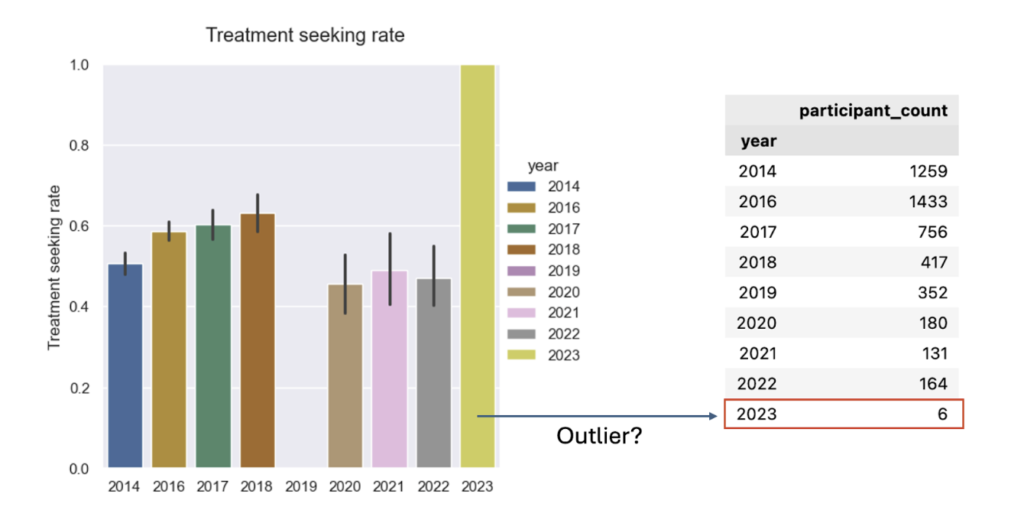
- Treatment-seeking over time: The multi-year picture shows higher treatment-seeking rates pre-2019 than post-2019. It’s important to note the apparent “dip” in 2019 is not a measured dip. In 2019 the treatment question was omitted, so that year’s rate is missing rather than lower.
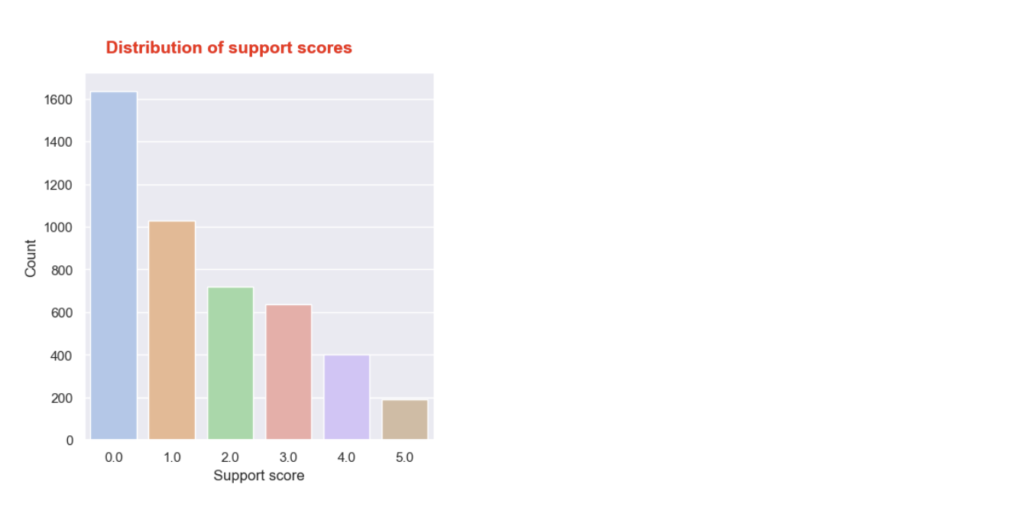
- Support score distribution: The distribution looks comparable to the one for 2014, but with a wider gap between scores 4 and 5. Again, most employees report receiving no or very little support.
- Support score → treatment (dose-response): The pooled curve shows a steadier increase in treatment-seeking as support score rises, then plateaus after ~3. With many more responses, the error bars are smaller, so we can confidently see differences between more support-score groups. Stats reveal new significant pairwise differences:
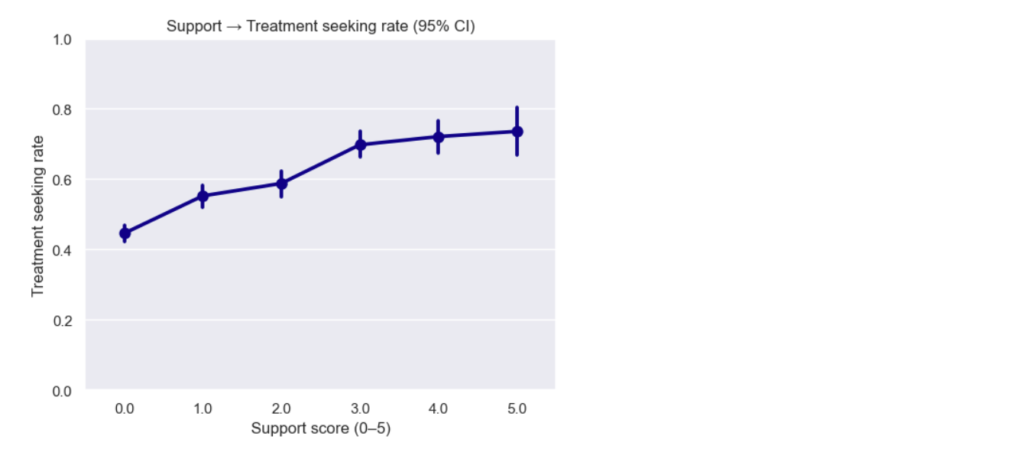
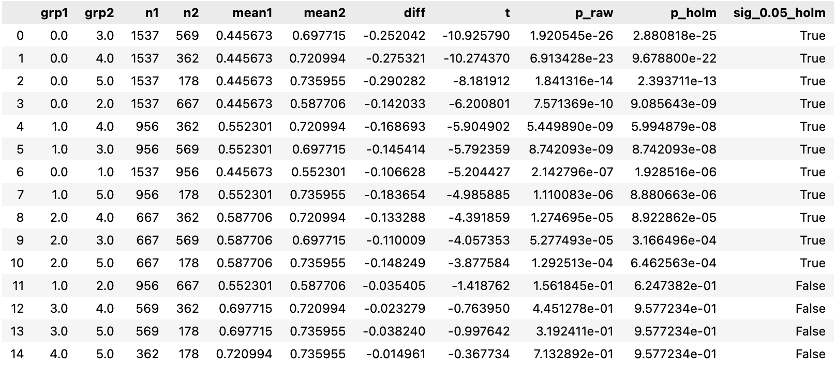
Stats reveal new significant pairwise differences:
- Previously: 0 vs 0 vs 0 vs 0 vs ≥ ≥ ≥ ≥1 1 1 1, 1 vs 3
- Now: 0 vs ≥ 1, 1 vs ≥ 3, 2 vs ≥ 3 (plus several neighbors trending)
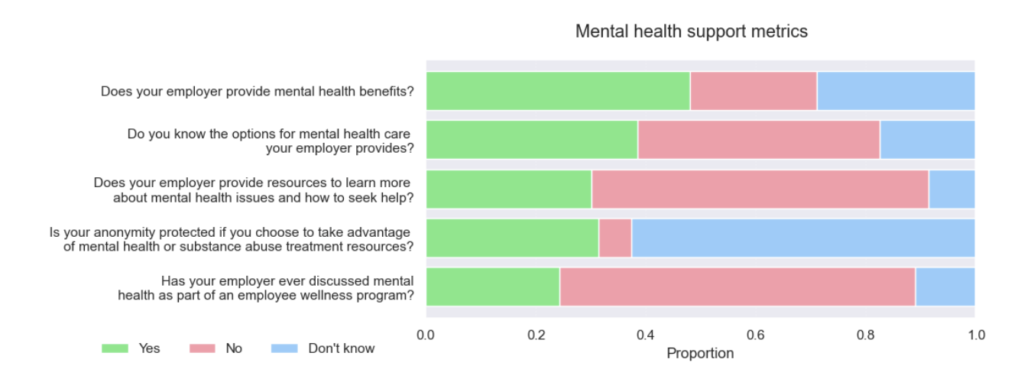
- Policy awareness proportions (five questions): Awareness is still low. Aside from a modest improvement in the first question (proportion of “Yes” increased), most either worsened or stayed flat. Here, worse means more “No” and “Don’t know” responses.
- Policy pillars → treatment (five questions) The pooled data reproduces 2014’s shape and adds a few new significant gaps:
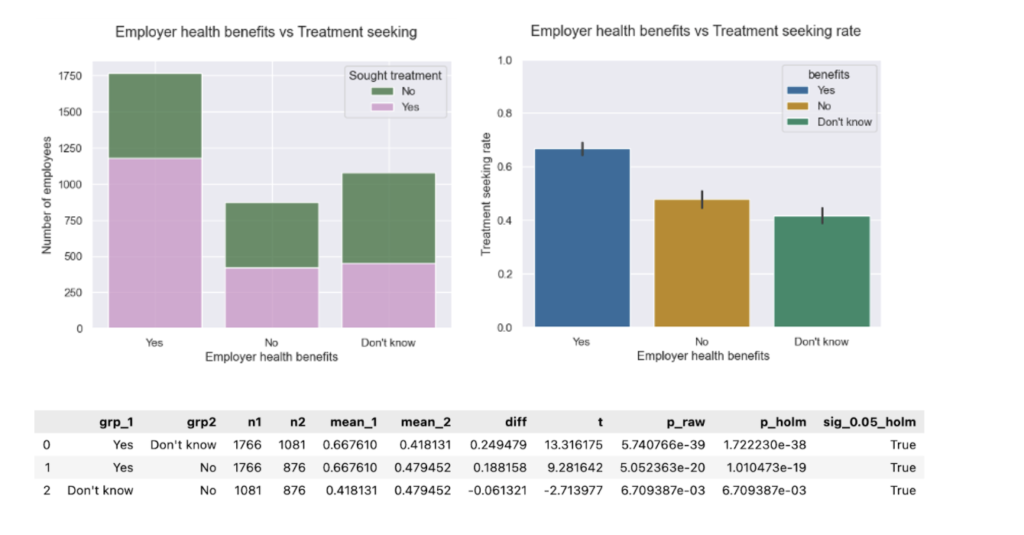
- Benefits vs. treatment. Proportions show slight improvement toward “Yes”. However, treatment-seeking rates remain comparable to the baseline. Having mental healthcare access is a major driver of treatment-seeking.
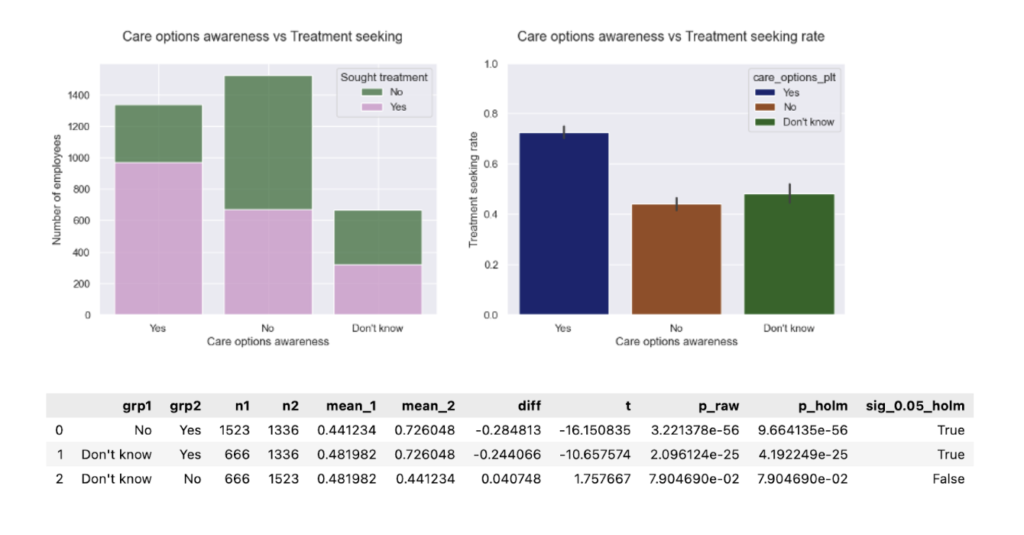
- Care options awareness vs. treatment. Proportions and treatment-seeking rates remain comparable to baseline. Knowing how to access care represents the largest policy lift in the pooled data.
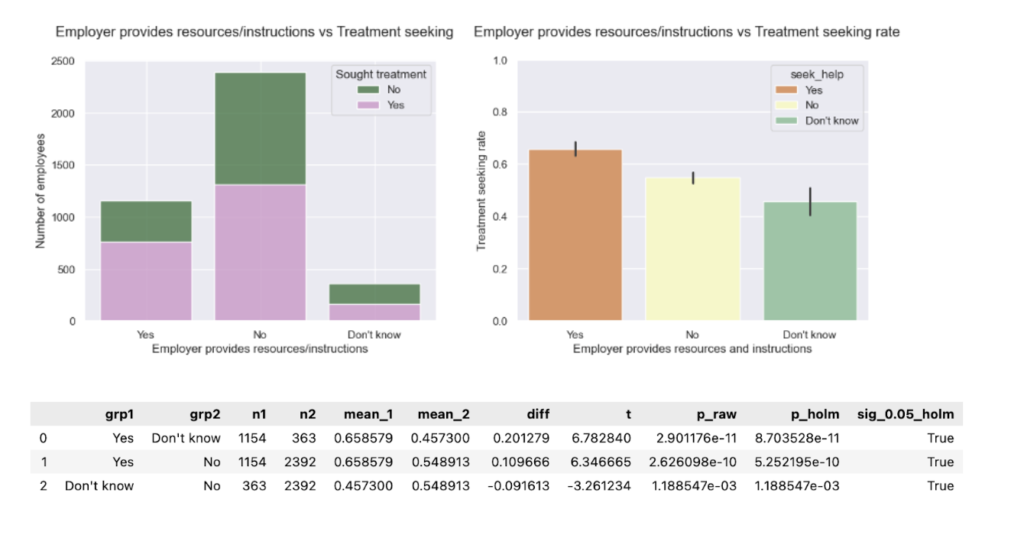
- Seek-help resources vs. treatment. Proportions remain comparable to baseline. Treatment-seeking rates reveal a new significant gap: “No” ≠ “Don’t know.” (In 2014 this difference wasn’t significant). Uncertainty is its own risk. Providing practical guides to seek help can make a crucial difference for those who would pursue the help they need if they knew how to go about it.
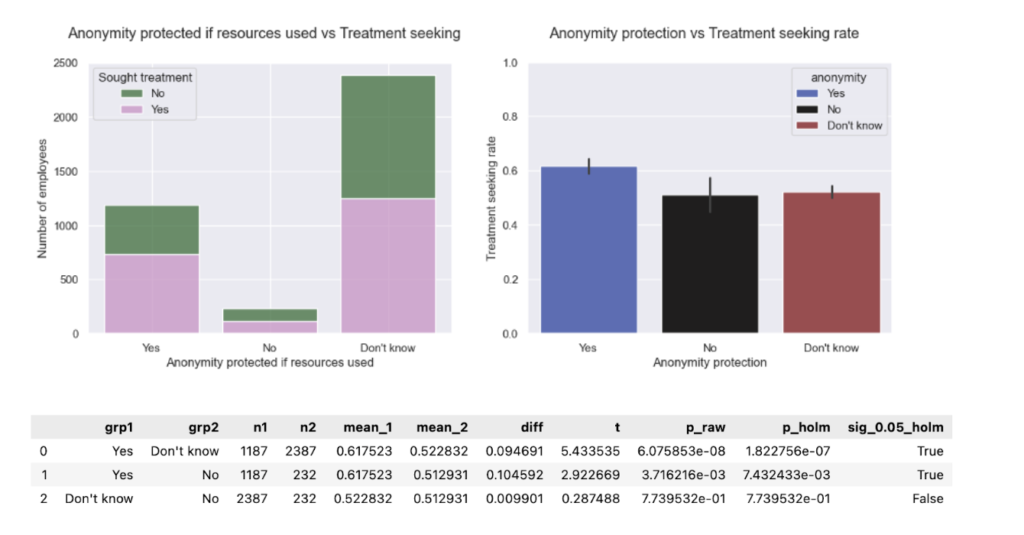
- Anonymity protection vs. treatment. Proportions are comparable to baseline. Treatment-seeking rates for “Yes” differ from “No.” (In 2014 this difference wasn’t significant). Privacy clarity seems to carry significant weight here.
- Wellness program (discussion) vs. treatment. Proportions and treatment-seeking rates are comparable to baseline. Providing mental healthcare in combination with wellness programs drives treatment-seeking.

- Family history vs. treatment The pooled data surfaced an “I don’t know” family-history group that wasn’t visible in 2014. Notably, ~60% of this group reported having sought treatment-about 2x the “No” group (~30%) yet below “Yes” (~80%). Uncertainty is an elevated-risk signal and should prompt proactive outreach (education, screening, benefits navigation) rather than being treated like “No.”
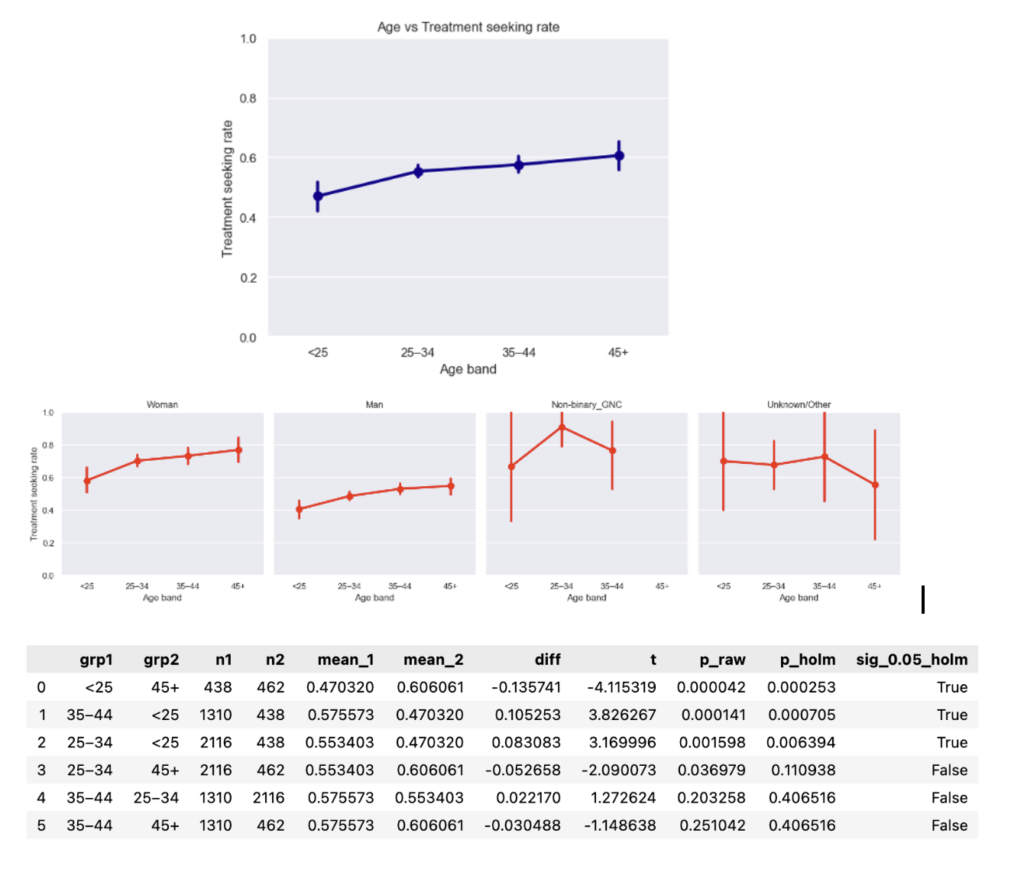
- Age & gender vs. treatment The monotonic age trend (older → higher treatment-seeking) persists; in the pooled data. However, age groups are now significantly different overall, elevating age as a potential risk factor to manage.
- Work interference vs. treatment The proportion of respondents reporting “Sometimes/Often” interference grew substantially vs. 2014; within category treatment-seeking rates (e.g., among “Sometimes/Often”) stayed comparable to the baseline.
5 recommendations for tech business leaders
- Make support unmissable. The top gains still come from visibility. Accordingly, it is important to put benefits, access steps, and anonymity in onboarding, on the company’s intranet, and in managers’ 1:1 playbooks.
- Don’t let “Don’t know” persist. It tends to behave like “No” for outcomes. If you only fix one thing, fix discoverability.
- Train managers. They are the distribution channel for seek-help instructions and privacy assurances.
- Watch work interference. The Sometimes/Often group is larger than in 2014. In order not to shortchange people who need help, budget EAP/counseling capacity to meet that demand.
- Mind the age gradient. Younger employees (especially men) continue to seek treatment less-target communication and manager nudges accordingly.
Limitations
- Observational data. Associations ≠ causation.
- Instrument differences. 2019 lacks the treatment item; later waves have smaller N.
- Self-report bias. Outcomes and exposures are reported by respondents.
Where this could go next (subject to time & data quality):
- Try a multivariable model to see which factors most strongly contribute to treatment.
- Test policy importance by recomputing the support score while dropping one policy at a time.
Acknowledgments
Thanks to OSMI for maintaining and sharing the longitudinal survey, and to the NYC Data Science Academy community for feedback on the harmonization and plotting pipeline.
References
- Mental Health in Tech: Which Workplace Policies Work?
- Tech’s ongoing mental health crisis
- Asana Anatomy of Work Index 2022
- The Health and Economic Burden of Employee Burnout to U.S. Employers
Leave a Reply